Data & Statistics
Fresh, parallel-form problems with full worked solutions — more reps for the skills in this unit, kept separate from the textbook's own problems.
Read Appendix in the textbook →
Lesson A.1: One-variable statistics — center & spread
For the data set {6, 2, 9, 3}, find the mean, median, mode, and range.
Worked solutionTry it first, then open.
Mean: (6+2+9+3)/4 = 20/4 = 5.
Median: order the values first → 2, 3, 6, 9. Even count (4 values), so average the two middle ones: (3+6)/2 = 4.5.
Mode: no value repeats, so there is no mode.
Range: max − min = 9 − 2 = 7.
So mean 5, median 4.5, no mode, range 7.
Answer: 5
For the data set {4, 4, 7, 9, 6}, find the mean, median, mode, and range.
Worked solutionTry it first, then open.
Mean: (4+4+7+9+6)/5 = 30/5 = 6.
Median: order first → 4, 4, 6, 7, 9. Odd count (5 values), so the middle one is 6.
Mode: 4 appears twice (everything else once), so the mode is 4.
Range: 9 − 4 = 5.
So mean 6, median 6, mode 4, range 5.
Answer: 6
For the data set {8, 12, 12, 20}, find the mean, median, mode, and range. Then say which of the mean or median better describes a 'typical' value here, and why.
Worked solutionTry it first, then open.
Mean: (8+12+12+20)/4 = 52/4 = 13.
Median: order first → 8, 12, 12, 20. Even count, so average the two middle values: (12+12)/2 = 12.
Mode: 12 appears twice, so the mode is 12.
Range: 20 − 8 = 12.
Typical: the mean (13) sits a little above the median (12) and above the cluster at 8–12, pulled up by the larger value 20. So the median (12) is the slightly fairer 'typical' here. The gap is small, so it is a mild effect, not a dramatic outlier.
Answer: 13
For the data set {2, 2, 5, 5, 40}, find the mean, median, mode, and range. Identify the outlier and explain what it does to the mean compared with the median. If you removed the outlier, which of the two would change a lot and which would barely move?
Worked solutionTry it first, then open.
Mean: (2+2+5+5+40)/5 = 54/5 = 10.8.
Median: order first → 2, 2, 5, 5, 40. Middle value is 5.
Mode: both 2 and 5 appear twice, so it is bimodal — modes 2 and 5.
Range: 40 − 2 = 38.
Outlier: 40 sits far above the cluster at 2–5, so 40 is the outlier. It drags the mean way up to 10.8 — above every clustered value — while the median stays right in the cluster at 5.
Remove the outlier (just 2, 2, 5, 5): the mean falls to (2+2+5+5)/4 = 14/4 = 3.5 (a drop of 7.3), while the median only shifts from 5 to (2+5)/2 = 3.5 (a drop of 1.5). So removing 40 moves the mean a lot but the median only a little — exactly why the median is the fairer 'typical' when an outlier is present.
Answer: 54/5
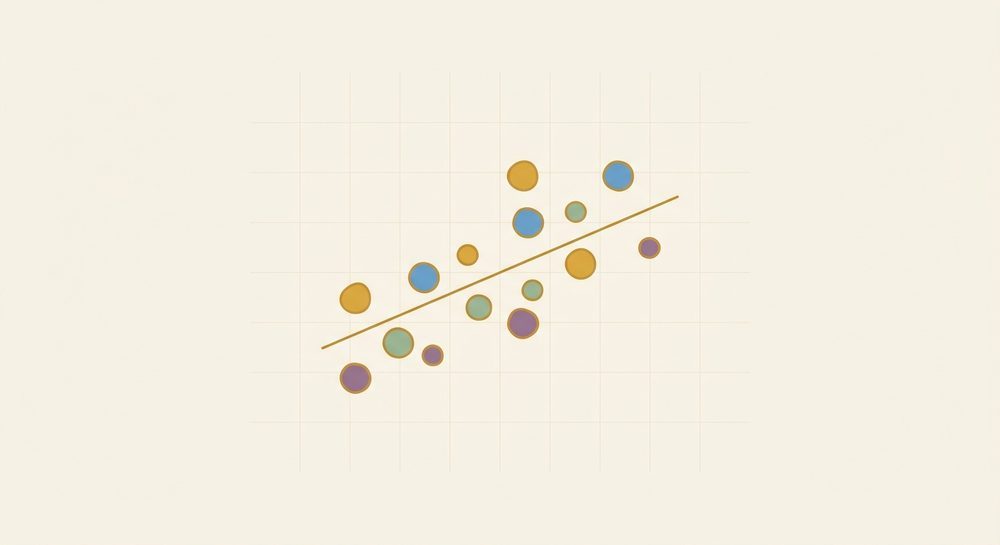
Lesson A.2: Two-variable data — line of best fit, correlation vs. causation
A line of best fit for some data is y = 4x + 2. Predict y when x = 3.
Worked solutionTry it first, then open.
Predicting from a best-fit line is just evaluating the function f(x) = 4x + 2 (Unit 5.4): y = 4(3) + 2 = 12 + 2 = 14. So we predict about 14. Say 'about' — a best-fit prediction is an estimate, not a guarantee.
Answer: 14
A line of best fit is y = -3x + 20. Predict y when x = 5. Then say whether the association is positive or negative, and how the equation tells you.
Worked solutionTry it first, then open.
Predict: y = -3(5) + 20 = -15 + 20 = 5. So we predict about 5.
The slope is -3, which is negative, so as x increases y decreases — that is a negative association. (You read the direction straight off the sign of the slope, a Unit 5 idea.)
Answer: 5
A line of best fit built from data that ran from x = 2 to x = 8 is y = (1/3)x + 2. Predict y when x = 9. Is this prediction an interpolation (inside the data range) or an extrapolation (outside it), and which is more trustworthy?
Worked solutionTry it first, then open.
Predict: y = (1/3)(9) + 2 = 3 + 2 = 5. So we predict about 5.
The data ran from x = 2 to x = 8, and x = 9 is past 8 — so this is an extrapolation (outside the range). Extrapolations are less trustworthy: a best-fit line predicts best near the data it came from, and x = 9 reaches beyond it. A within-range prediction (an interpolation) would be safer.
Answer: 5
A town notices that in the months when cold-drink sales are highest, the number of people treated for sunburn is also highest — the two rise and fall together. Does buying cold drinks cause sunburns? Name the likely third factor (the lurking variable) and explain why this is correlation, not causation.
Worked solutionTry it first, then open.
No, cold drinks do not cause sunburns. This is a classic correlation-without-causation case. A hidden third factor — the season / hot sunny weather — drives both: on hot days people buy more cold drinks AND spend more time in the sun (so more sunburn). That hidden cause is called a lurking (or confounding) variable. The lesson: 'two things move together' is correlation, and correlation by itself never proves one causes the other — always ask whether a third factor could explain both.
Answer: No — correlation, not causation. The lurking (third) variable is the season / hot weather: hot days drive both more cold-drink sales and more sunburns. Two things moving together never by itself proves one causes the other.
Lesson A.3: Two-way tables
A survey of 40 students records whether each plays an instrument (rows) and whether each takes an art class (columns):
$$\begin{array}{c|c|c|c}
& \text{Art} & \text{No Art} & \textbf{Total} \\ \hline
\text{Instrument: Yes} & 15 & 5 & ? \\ \hline
\text{Instrument: No} & 5 & 15 & ? \\ \hline
\textbf{Total} & ? & ? & ?
\end{array}$$
Find the row total for Instrument: Yes.
Worked solutionTry it first, then open.
The row total is the sum across the row: 15 + 5 = 20. So 20 students play an instrument.
Answer: 20
Using the same 40-student table (Instrument rows × Art columns; cells: Yes-row 15 and 5, No-row 5 and 15), find the column total for the No Art column.
Worked solutionTry it first, then open.
The column total is the sum down the column: 5 (Instrument-Yes & No-Art) + 15 (Instrument-No & No-Art) = 20. So 20 students take no art class. (Check: the other column, Art, is 15 + 5 = 20, and 20 + 20 = 40 = the grand total.)
Answer: 20
Using the same 40-student table, what fraction of all students both play an instrument and take an art class? (a joint relative frequency) Give it as a fraction and a percent.
Worked solutionTry it first, then open.
'And' over everyone is a joint relative frequency: take that one cell over the grand total. The Instrument-Yes & Art cell is 15, and the grand total is 40, so the fraction is 15/40 = 3/8 = 0.375 = 37.5%.
Answer: 3/8
Using the same 40-student table, of the students who take an art class, what percent play an instrument? (a conditional relative frequency) Then find the same rate for students who take no art class, compare the two, and say whether playing an instrument and taking an art class are associated.
Worked solutionTry it first, then open.
Conditional means 'within one group,' so divide by that group's total, not the grand total.
Of the art-takers: the Art column total is 15 + 5 = 20, and 15 of them play an instrument, so 15/20 = 3/4 = 75%.
Of the non-art students: that column total is 5 + 15 = 20, and 5 play an instrument, so 5/20 = 1/4 = 25%.
Compare: 75% vs 25% are very different, so yes — playing an instrument and taking an art class are associated here (art-takers are much more likely to play an instrument). If the two rates had been about equal, there would be little or no association.
Answer: 3/4
Mixed review
Problems that mix skills from across the unit — good for spacing earlier work back in.
(Mixing A.1) For the data set {7, 11, 3, 9, 5}, find the mean, median, and range.
Worked solutionTry it first, then open.
Mean: (7+11+3+9+5)/5 = 35/5 = 7.
Median: order first → 3, 5, 7, 9, 11. Middle value is 7.
Range: 11 − 3 = 8.
So mean 7, median 7, range 8. (No value repeats, so there is no mode.)
Answer: 7
(Mixing A.2) A line of best fit is y = 2x + 5, built from data running from x = 1 to x = 7. Predict y when x = 8, and state whether this is an interpolation or an extrapolation.
Worked solutionTry it first, then open.
Predict by evaluating the line: y = 2(8) + 5 = 16 + 5 = 21. So we predict about 21.
The data ran from x = 1 to x = 7, and x = 8 is past 7, so this is an extrapolation (outside the data range) — less trustworthy than a prediction made within the range.
Answer: 21
(Mixing A.3) A survey of 60 people records whether each commutes by bike (rows) and whether each lives downtown (columns):
$$\begin{array}{c|c|c|c}
& \text{Downtown} & \text{Suburb} & \textbf{Total} \\ \hline
\text{Bike: Yes} & 18 & 6 & 24 \\ \hline
\text{Bike: No} & 12 & 24 & 36 \\ \hline
\textbf{Total} & 30 & 30 & 60
\end{array}$$
Of the people who live downtown, what fraction commute by bike? Give it as a fraction and a percent.
Worked solutionTry it first, then open.
This is a conditional relative frequency 'within the downtown group,' so divide by the downtown column total (30), not the grand total. Of the 30 downtown residents, 18 bike, so 18/30 = 3/5 = 60%.
Answer: 3/5
(Mixing A.2 reasoning) Across many grocery stores, stores with more employees tend to have higher monthly sales. Does hiring more employees cause higher sales? Name a likely lurking variable and explain why this is correlation rather than causation.
Worked solutionTry it first, then open.
Not necessarily — this is correlation, not proven causation. A hidden third factor — the size of the store (or its town) — plausibly drives both: a bigger store needs more employees AND serves more customers, so it sells more. The size is the lurking (confounding) variable. 'They move together' (more employees with more sales) does not by itself prove that adding employees causes the sales; always ask whether a third factor could explain both.
Answer: No — correlation, not causation. The lurking variable is store/town size: bigger stores have more employees AND sell more, so both rise together without one causing the other.
(Mixing A.2) A line of best fit is y = -4x + 30. Predict y when x = 6, and say whether the association is positive or negative and how you can tell.
Worked solutionTry it first, then open.
Predict: y = -4(6) + 30 = -24 + 30 = 6. So we predict about 6.
The slope is -4 (negative), so as x increases y decreases — a negative association. You can tell straight from the sign of the slope: a negative slope means a downward (negative) trend.
Answer: 6